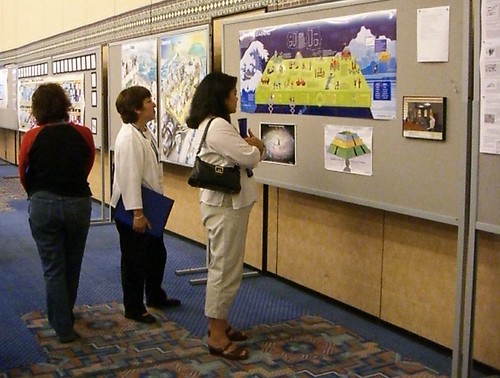
The Graphic Learning Gallery at Learning 2006
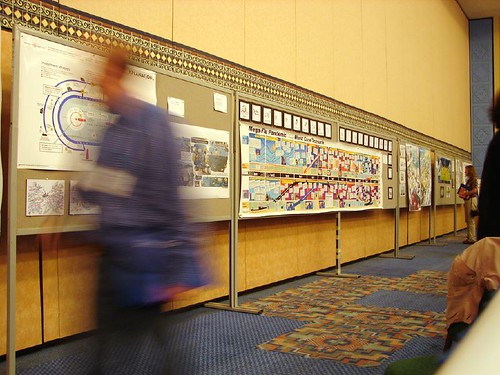
To the best of our knowledge, this is the first exhibit of its kind. The Gallery walls are lined with argumentation maps, Xplanations, Mindscapes, Storymaps, visualizations, idea maps, instructional cartoons, learning cards, and visual journalism. Join gallery curator Jay Cross to hear and share stories about the power of visual learning.
Why graphics?
Visual literacy accelerates learning because the richness of the whole picture can be taken in at a glance. Visual metaphors unleash new ideas and spark innovation. Having a sharper eye increases the depth of one’s perception and enjoyment of life.
We humans are sight-mammals. We learn twice as well from images and words as from words alone. Visuals engage both processing styles of the brain: the linear and the radiant. Pictures translate across cultures, education levels, and age groups. Yet the majority of the content of corporate learning is text. Schools spend years on verbal literacy and but hours on visual literacy. It’s high time for us to open our eyes to the possibilities.
At Learning 2006, the Graphic Learning Gallery pays homage to the Picassos and Cézannes of learning graphics. We want you to experience the power of visual learning by seeing it for yourself.
Don't miss our Envisioning resource page
Exhibits at the Graphic Learning Gallery at Learning 2006
Robert Horn, Stanford University, The Pandemic Mural, 2006
Michael Erickson, The Boeing Company, System of Systems, 2006
Michael Erickson, The Boeing Company, Net-Centric Manufacturing, 2006
David Sibbet, The Grove Consultants, National Semiconductor Vision, 1993
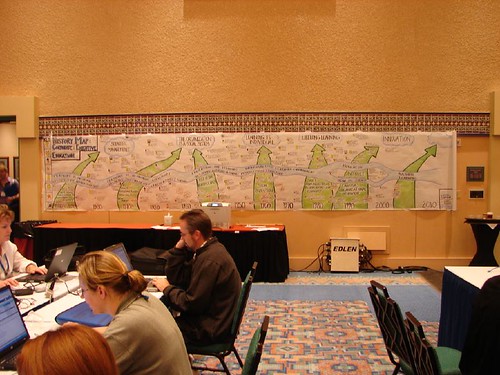
The Grove Consultants, Educational Technology Horizon 2000-2010, 2000
Nancy Margulies, Mindscapes, 2006
Brian Narelle, The knOwhere Process, for MG Taylor, 2000
Eileen Clegg, Visual Insight, Learning 2006 as-it-happens, 2006
Root Learning, Today & Tomorrow, 2003
XPLANE, Informal Learning, 2006
XPLANE, Anheuser Busch, 2001
XPLANE, Munder@dvantage, 2001
Jamie Nast, Idea Mapping, Laws of Idea Mapping, 2006
Megan Clark, Ford Motor Company, map of Gordon MacKenzie’s Orbiting the Giant Hairball
Debbie Showler, SCS Ltd., map of The One to One Future by Don Pepper and Martha Rogers, 1995
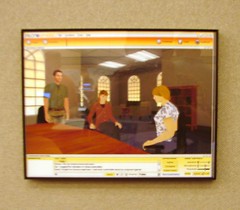
ProtonMedia, ProtoSphere 3-D Learning Environment, 2006
Backgrounds
Robert Horn has pioneered informal learning with visual language, the combination of words and images to make meaning. ![]() His current work focuses on social messes and social learning that help problem-solving groups get started and stay on the same page. His public policy projects use visual analytics to model and communicate complex issues.
His current work focuses on social messes and social learning that help problem-solving groups get started and stay on the same page. His public policy projects use visual analytics to model and communicate complex issues.
Bob’s argumentation mapping project at Stanford has focused on building large visual diagrams of major philosophical arguments. In one sense, they represent at new genre of diagramming, in that they are conceptual "maps" of a major ongoing debates. In a wider sense, they present a new way of showing how  world-wide,interdisciplinary debates are taking place, hence the name argumentation mapping™. The maps are used for teaching, learning, and research. In teaching they provide the big-picture overviews that are often very difficult to convey in any other way, especiallyin diffuse, sprawling, interdisciplinary arguments.
Bob enjoys tackling “wicked problems.” His charts of the struggle of narratives, begun right after 9/11 sent chills up myspine.
Robert’s website at Stanford: http://www.stanford.edu/~rhorn/
The Pandemic Mural in the gallery is at www.stanford.edu/~rhorn/b/uc-scnroH5N1NotQtWrstV13.pdf
Don’t miss Mapping the Human Cognome

David Sibbetis founder of The Grove Consultants and the father of corporate Group Graphics®
In 2000, The Grove received a grant from the U.S. Department of Education, Office of Educational Technology to develop a forecast map for policy makers. The map also needed to appeal to other stakeholders in education and technology: students, parents, educators, administrators, researchers, business people and funders. Together with the Institute for the Future, The Grove was asked to provide a map that illustrated the “big picture” and assisted decision making relating totechnology in education. The Grove continues to publish the map upon requests from education foundations, school districts, and state and university education departments.


Look at Narelle Creative for samples: http://www.narellecreative.com/

 Dave Gray and his firm do the infographics you see in Business 2.0 magazine, but that’s just the tip of the iceberg. Dave is founder and CEO of XPLANE, the visual thinking company. Since 1993, XPLANE has helped hundreds of companies — from middle market to global giants — reduce complexity and increase the clarity and effectiveness of their communications. XPLANE’s Xplanations depict processes in entertaining but business-like fashion.
The XPLANE staff are artists but they are pragmatic. I worked with them on the Informal Learning poster that summarizes my book, as well as the visual thinking/ new initiative graphic we did for a T+D magazine article.

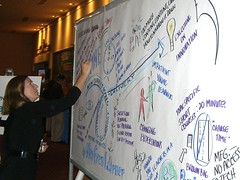 Eileen Clegg is a visual journalist well known to those who attend Elliott Masie’s events. An author and former newspaper reporter, Eileen draws interpretive murals as events unfold and then astounds her audience with well-measured descriptions of the main points while walking people through her drawing.
Eileen will be creating a visual journal and sharing Writing on the Walls at Learning 2006. Look at samples of Eileen’s work at Visual Insight, http://www.visualinsight.net
 Michael Erickson is a corporate cartoonist and visual practitioner at The Boeing Company’s Commercial Airplanes Division. From Michael’s website:
“The Visual Practitioner is someone who uses art, but is also part facilitator, part system analyst or technical modeler, part strategist and visionary, part psychologist and communicator.
While there are NO definitive examples of what a visual practitioner is or isn't, there are a number of individuals applying visual tools across a range of activities and from a number of different viewpoints who have begun to adopt the "visual practitioner" description for what they do. The results is that teams of designers, groups of business leaders, whole organizations and to a certain extent, even movements use the stuff produced by these ‘visualizers’ to think about their choices, plans, systems and so on in a different light.”

Idea Mapping

The book’s
… a simple and profound tool that helps individuals improve planning, creativity, thinking and learning, while simultaneously creating and producing incredible results. An idea map is a colorful, single-page diagram that visually captures issues weface each day. This technique gives people the increased ability to more competently plan, organize, communicate, remember, innovate, and learn -- and accomplish these faster than ever before! By engaging both hemispheres of the brain, this approach frees us to think, see, and understand far more efficiently than when using a multi-page, linear document outlining the same information. The associative process that Idea Mapping uses is easy to learn and mirrors how the brain naturally and freely connects information.
Why don’t I call these mind maps? Like LEGO®
 Ron Burns
Comments (0)
You don't have permission to comment on this page.